How Time-Series Drone Imagery Reveals Site Changes
Tracking changes on a construction site is a persistent challenge. A site that looked one way last week can look completely different today, and keeping everyone on the same page often means relying on memory, scattered photos, or subjective notes. Time-series drone imagery offers a more reliable method: it captures the site at regular intervals from the same angles, producing a visual record that can be compared side by side. This approach, often called site capture comparison, makes it possible to see exactly what has moved, been built, or been removed over days or weeks.
What time-series drone imagery is
At its simplest, time-series drone imagery is a set of aerial images taken of the same area on different flight dates. The key is consistency. The drone follows a similar flight path and altitude each time, so the images align closely enough to be overlaid or viewed in sequence. The result is a stack of visual data that shows how the site evolves. For a construction project, this might mean weekly flights that capture foundation work, framing, roofing, and finishing stages in order.
Because the images are georeferenced, they can be processed into orthomosaics. An orthomosaic is a composite image that corrects for perspective and distortion, so every pixel corresponds to a real-world coordinate. When you compare orthomosaics from different dates, you are looking at aligned, measurable imagery. A wall that appears in the second set but not the first is not a trick of the angle; it is a real change.
How the comparison works in practice
The process typically involves three steps: capture, process, and compare. First, the drone flies the site on a set schedule. The flight plan stays the same each time, which is critical. If the drone flew from a different starting point or at a different height, the images would not line up. Most operators use automated flight software to repeat the same mission.
Next, the raw images are uploaded to a drone data platform such as DataDelivery, where they are stitched into orthomosaics and sometimes into 3D models. The platform organises these outputs by flight date, so you can pull up any past capture instantly. This is where site capture comparison becomes practical: instead of flipping through folders of loose photos, you see a timeline of processed, aligned maps.
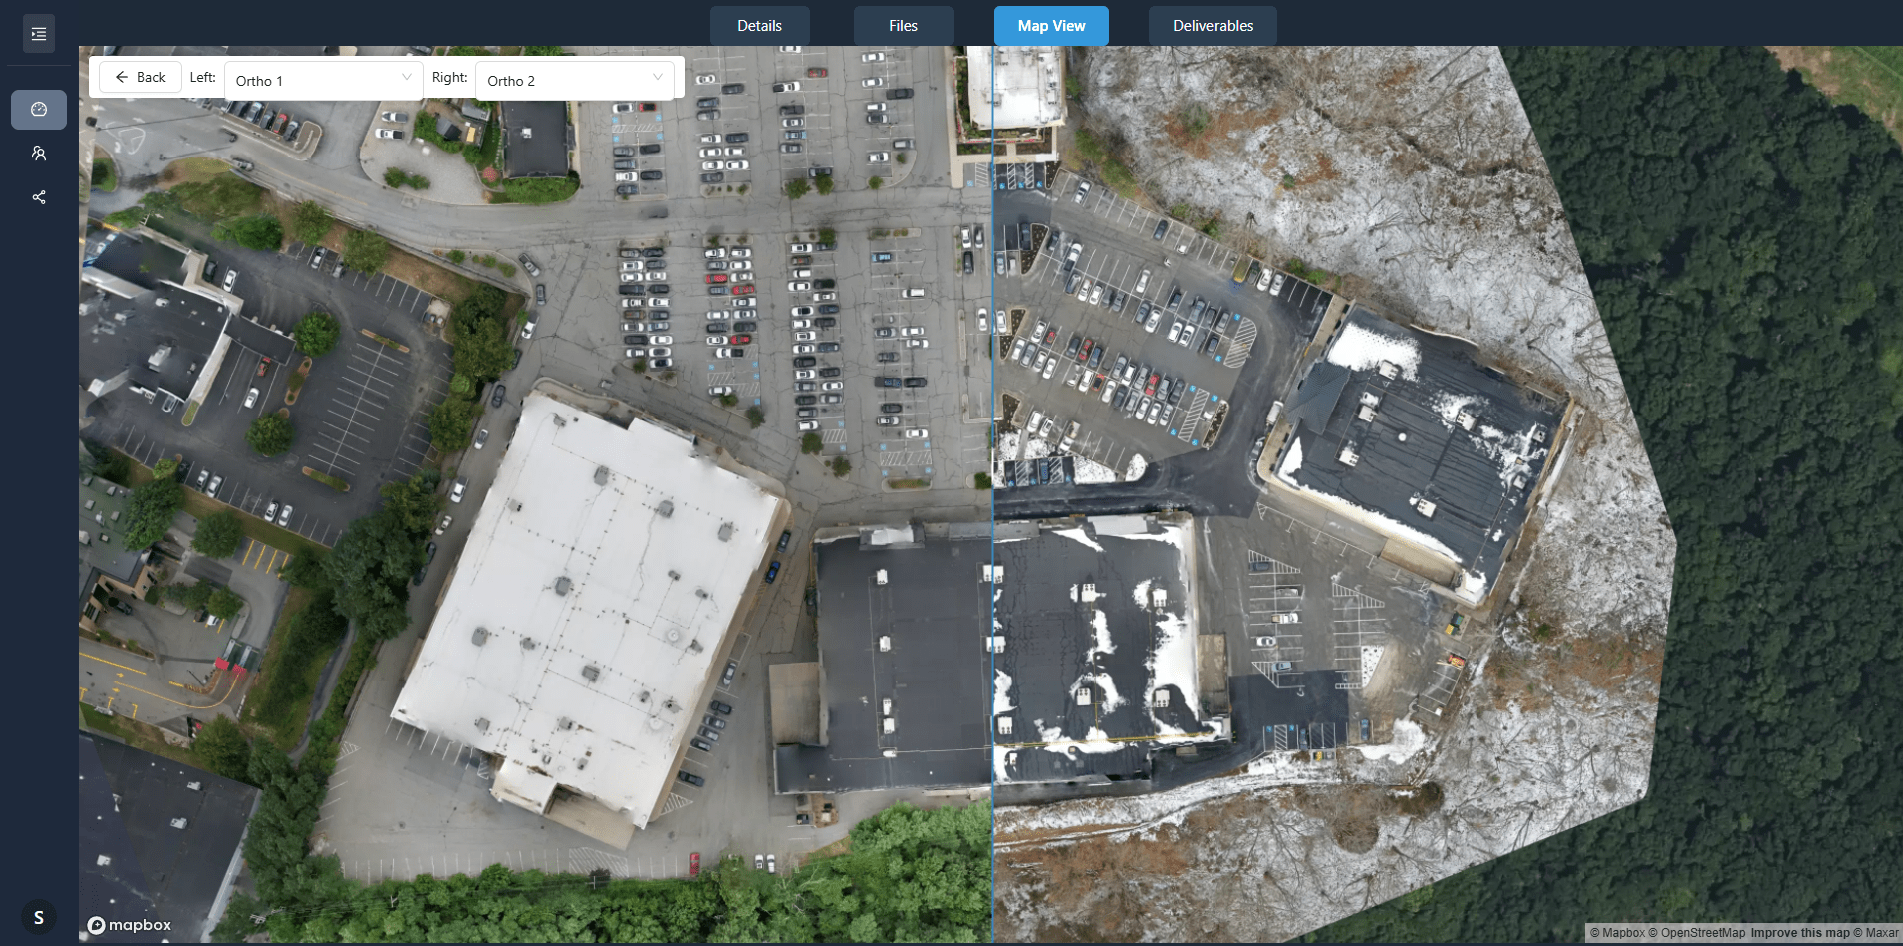
Finally, you compare two or more captures. Some platforms offer a slider tool that lets you fade from one date to another. Others highlight areas of change automatically using change detection algorithms. The software analyses the pixel differences and flags regions where new structures appear, where stockpiles have grown or shrunk, or where grading has occurred. These flagged areas can be saved as site annotations for the project team to review.
What change detection actually catches
Change detection is not magic. It works by comparing the reflectance values of each pixel between two images. If a patch of ground that was previously bare earth now shows a concrete slab, the pixels change colour and brightness. The algorithm marks that patch. But it can also pick up false positives: shadows shifting with the sun, puddles drying up, or vegetation changing colour. Good software lets you filter out these noise sources or set a sensitivity threshold.
For construction drone monitoring, the real value lies in catching small changes before they become big problems. A trench that was dug two weeks ago but not backfilled shows up clearly. A retaining wall that has moved a few centimetres might be visible in the side-by-side view. The team can then decide whether to investigate further or adjust the schedule. Without regular captures, those subtle shifts might go unnoticed until a structural issue emerges.
Building a project timeline with imagery
One of the strongest uses of time-series data is creating a visual project timeline. Instead of reading a written progress report, stakeholders can scroll through the captures in order and see the site take shape. This is especially useful for communicating with clients, investors, or regulatory bodies who do not visit the site regularly. A picture from last month and a picture from this week tell the story more clearly than a paragraph of text.
The timeline also serves as a record for disputes or claims. If a subcontractor says they completed a task on a certain date, the imagery can confirm it or show otherwise. If weather delays affected part of the site, the photos document the conditions. Over months, the collection of captures becomes a reliable archive that can be referenced years later if questions arise about how something was built.
Construction drone monitoring, when done consistently, provides this kind of documentation without relying on someone remembering to take photos. The drone flies, the data processes, and the timeline grows automatically. The human effort shifts from gathering evidence to interpreting it.
What to watch for when setting up captures
Getting useful time-series data depends on several practical factors. First, the flight schedule should be frequent enough to catch meaningful changes but not so frequent that it generates noise. Weekly is common for active construction, while monthly may suffice for slower projects. The schedule should also account for weather and daylight conditions. Flights at the same time of day reduce shadow variation, making comparisons cleaner.
Second, ground control points or GPS positioning help ensure alignment between captures. Without them, the orthomosaics might drift slightly, making the slider comparison look misaligned. Many drone data platforms can handle this automatically if the drone uses a RTK module or if you place visible markers on site.
Third, consider the file format and resolution. High-resolution orthomosaics take up more storage but allow you to zoom in on fine details. If your platform supports it, set a consistent ground sample distance so that each pixel represents the same area in every capture. This consistency matters when you measure distances or areas from the imagery.
Interpreting the results
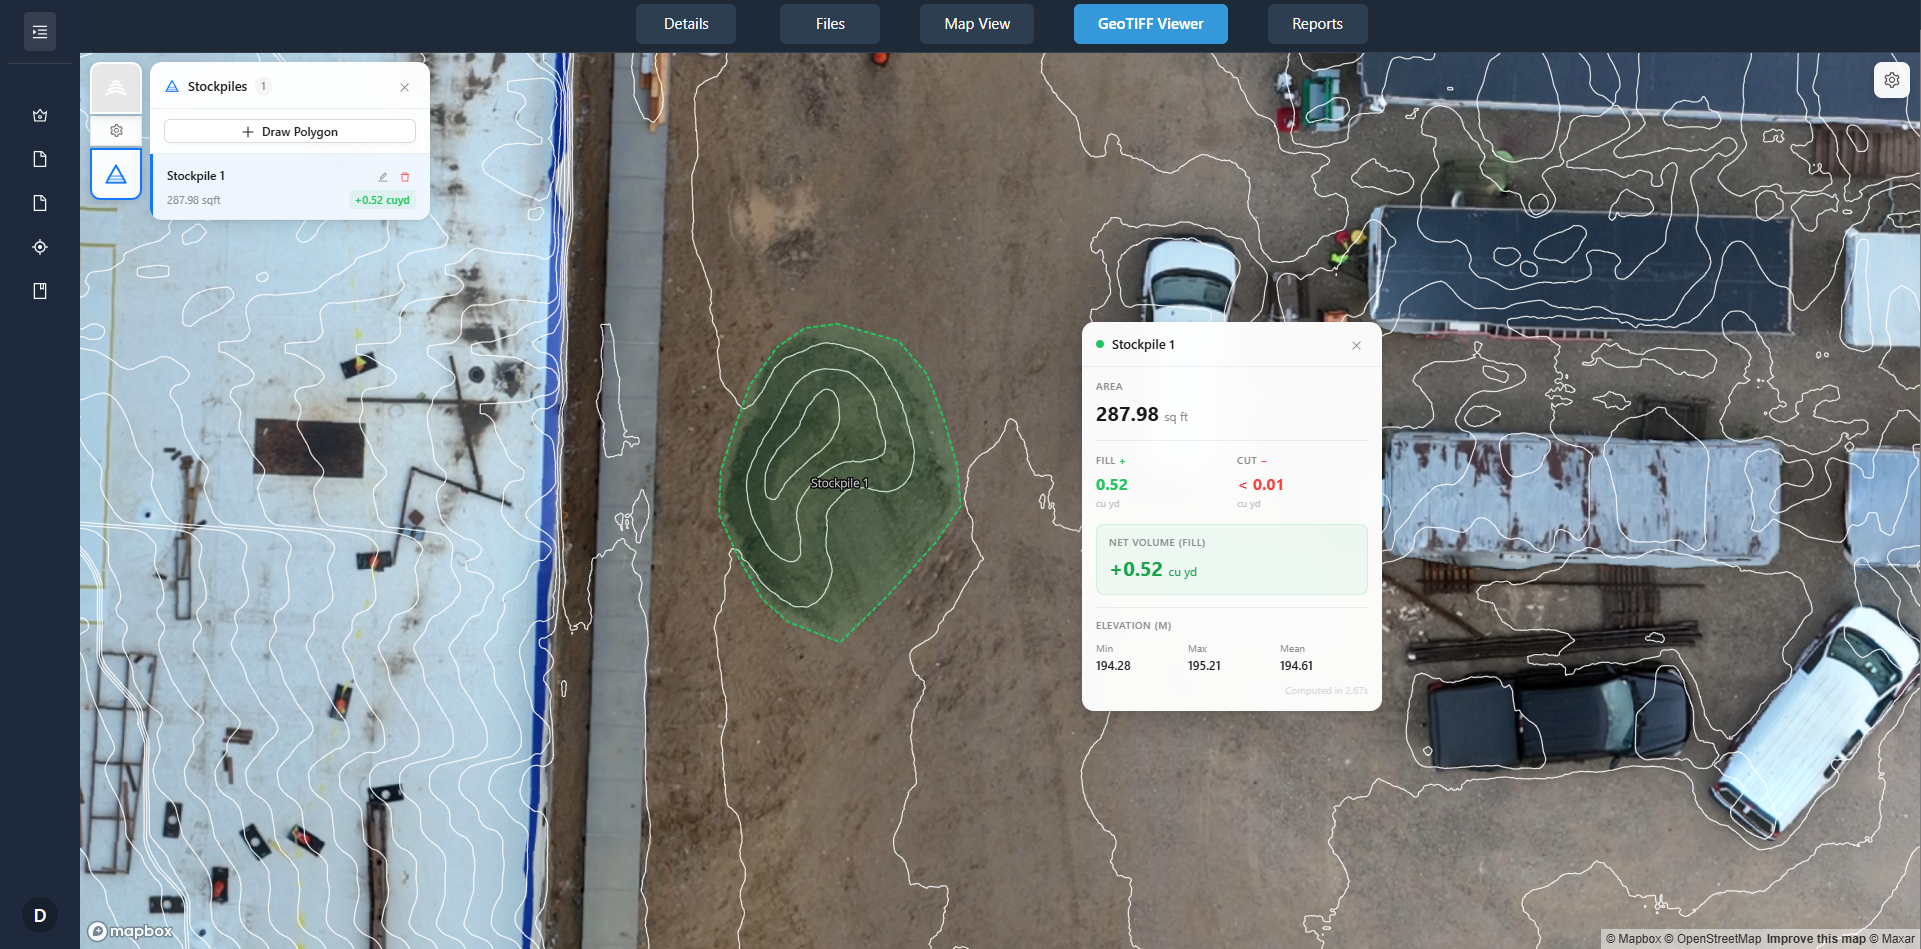
Once you have the comparison, the next step is deciding what the changes mean. A new stockpile of gravel might indicate that deliveries are on schedule. A slab that is still bare concrete after two weeks might mean the curing process is taking longer than expected. The imagery does not tell you the cause; it shows you the effect. That is where site knowledge comes in.
Project managers often use site annotations to mark up the captures with notes, questions, or action items. For example, an annotation might highlight a section of foundation that appears to have settled unevenly. The annotation can be shared with the structural engineer, who then reviews the imagery and decides if a site visit is warranted. This workflow keeps decisions grounded in visual evidence rather than guesses.
Limitations and how to work around them
Time-series drone imagery is not perfect. Vegetation can obscure the ground, especially in warmer months. Heavy rain can flood low areas and change the appearance of the site temporarily. And if the drone misses a flight due to weather or equipment issues, that gap in the record can be frustrating. The best approach is to plan for a buffer: fly a day early if the forecast looks bad, or schedule a make-up flight soon after.
Another limitation is that orthomosaics are 2D. They show the top-down view well, but they cannot capture vertical details such as the height of a wall or the depth of an excavation. For that, you might need a digital surface model or a 3D point cloud, which some drone data platforms can generate from the same flight data. Combining both gives a fuller picture.
Finally, the quality of comparison depends on the platform. A good drone data platform will let you overlay captures, adjust opacity, and export annotated images. It should also keep the processing steps consistent so that each orthomosaic is generated with the same settings. If the platform changes parameters between flights, the comparison becomes unreliable.
What this means for your project
Using time-series drone imagery turns site management from a reactive process into a proactive one. You see changes as they happen, not weeks later when someone notices a problem. The visual record also reduces misunderstandings. When everyone on the team can look at the same aligned image from the same date, there is less room for conflicting interpretations.
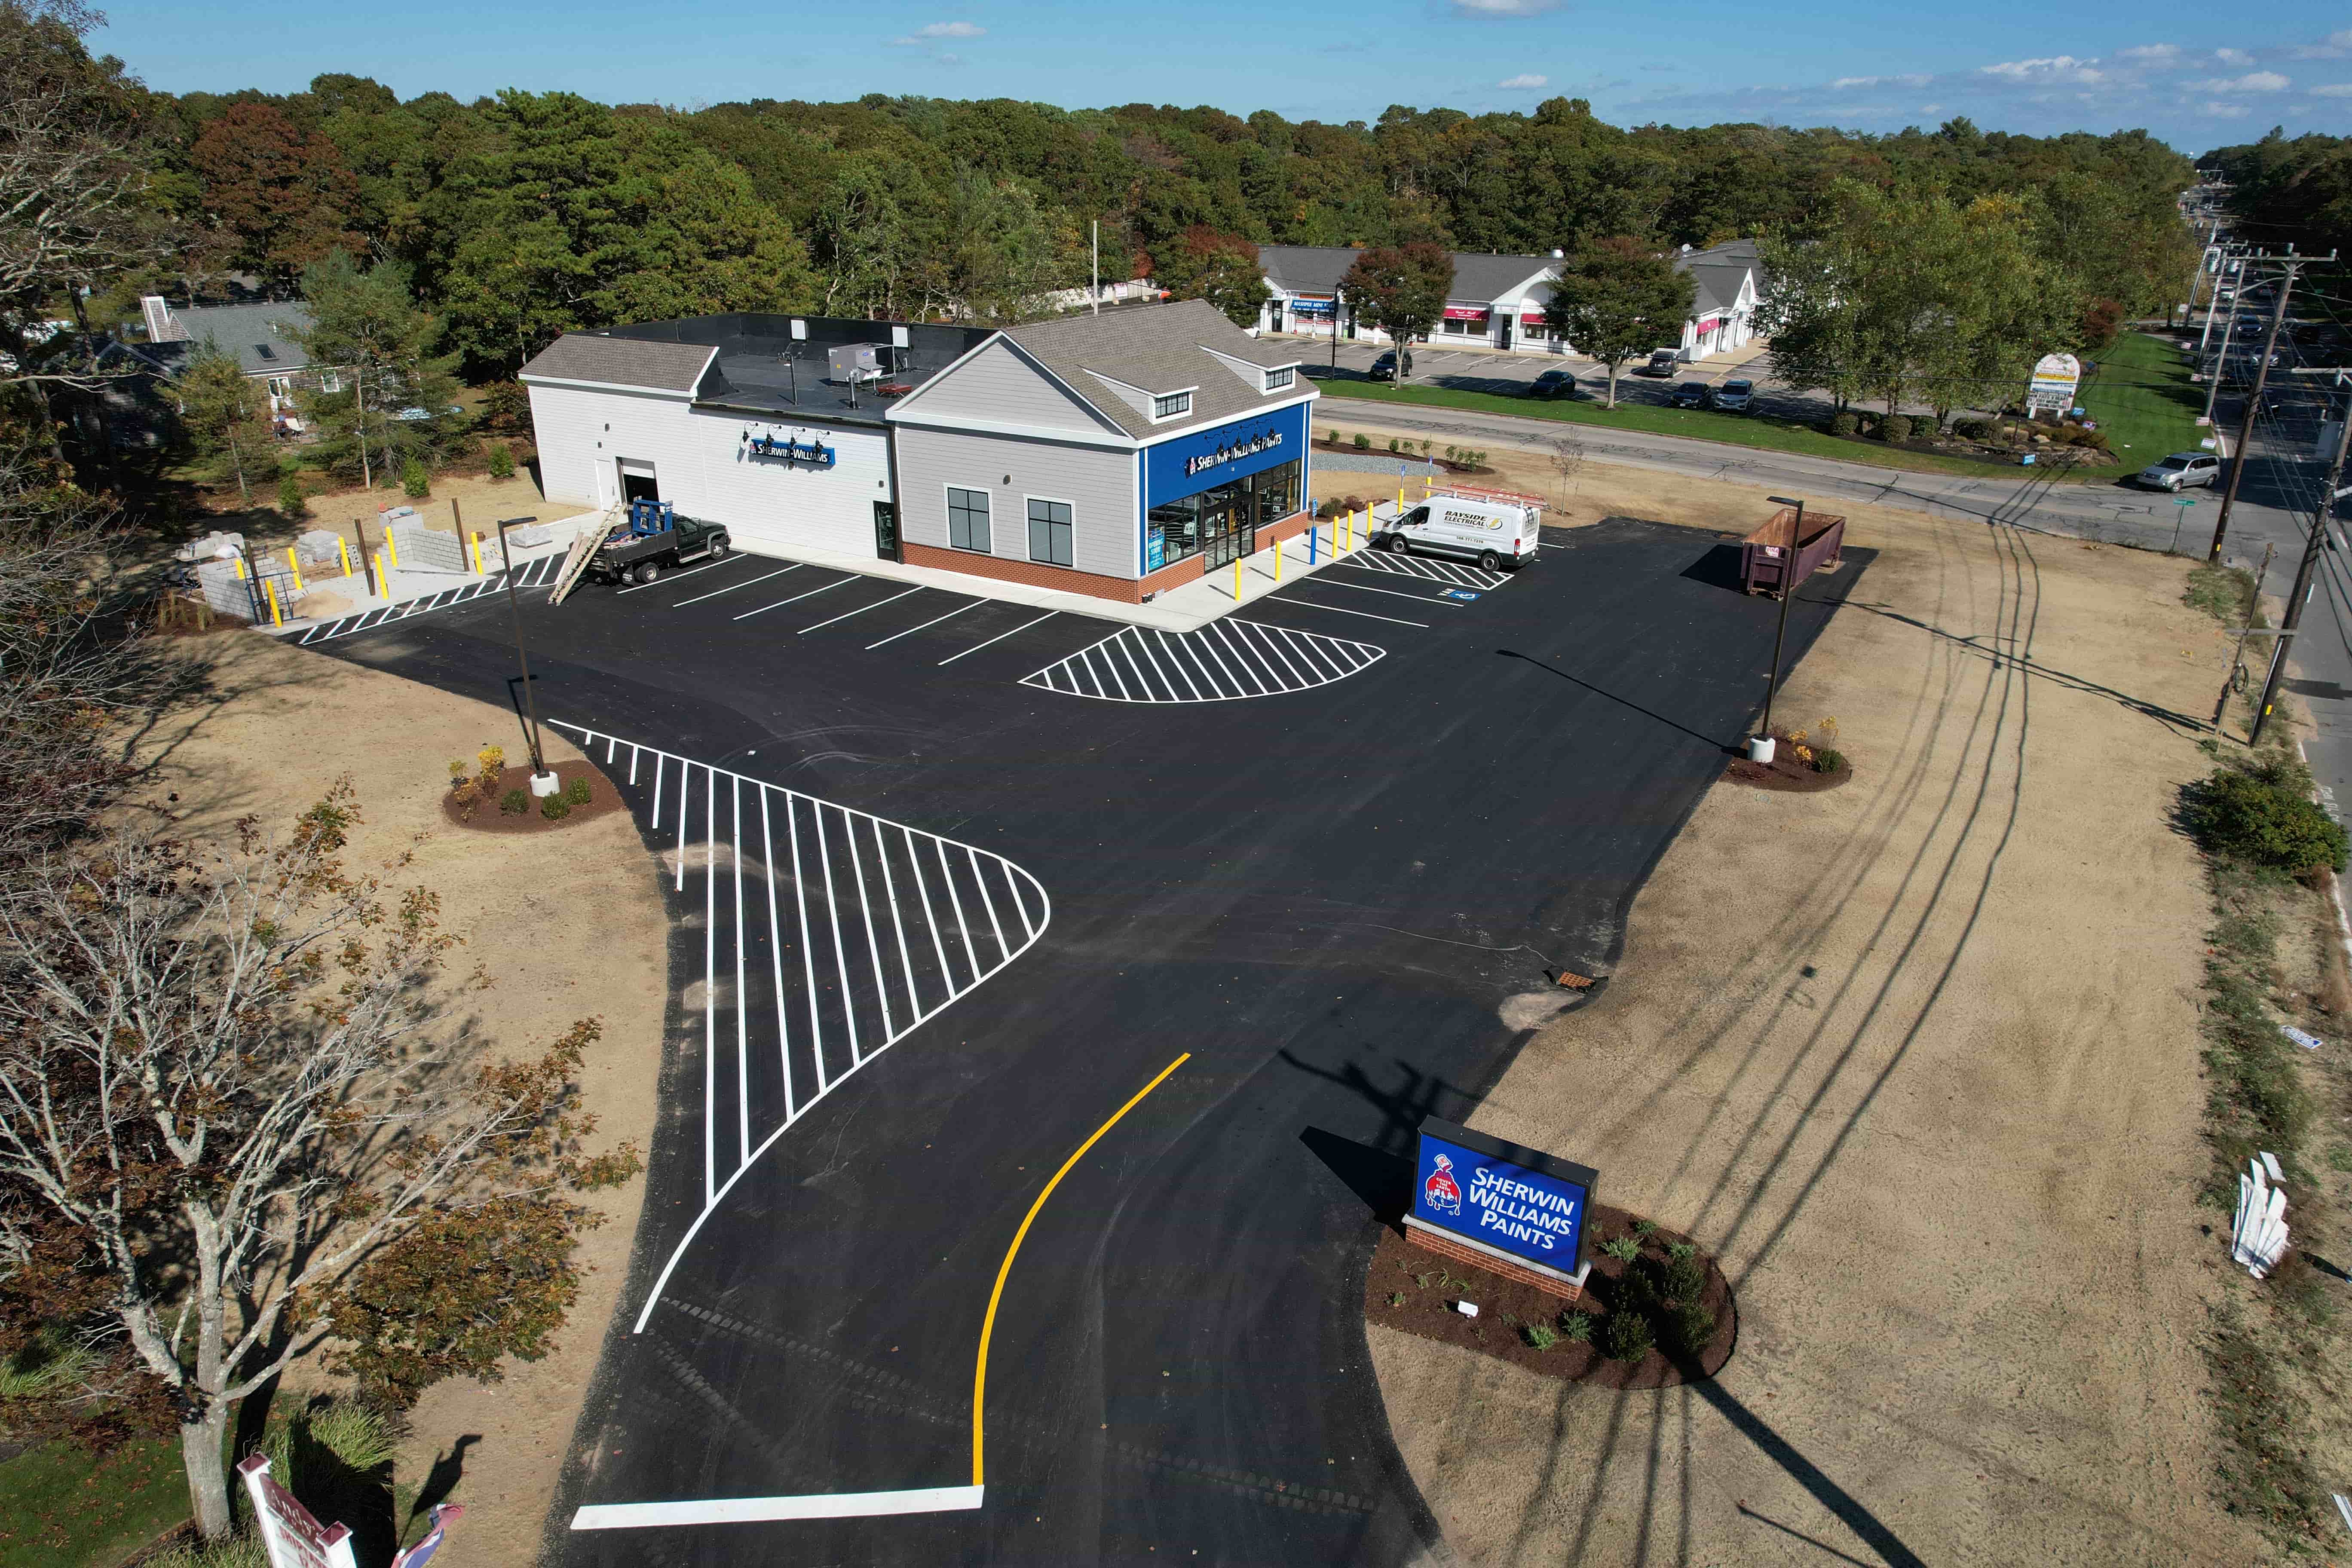
For projects that involve multiple contractors, phases, or stakeholders, the ability to compare captures side by side becomes a coordination tool. The site supervisor, the architect, and the client can each review the timeline from their own screen and discuss what they see. The imagery serves as the single source of truth for progress monitoring.
In the long run, the archive of captures becomes a valuable asset. If a warranty issue arises two years after construction, you have the visual record of how the site looked at each stage. If a future renovation or expansion is planned, the historical imagery shows where utilities, foundations, and other buried elements were placed. That kind of information is hard to gather any other way.
Time-series drone imagery is not just about taking pretty pictures from above. It is about creating a disciplined, repeatable process that captures reality at regular intervals. When paired with a platform that organises and compares those captures, it gives project teams a clear, objective view of how the site is evolving. That clarity helps everyone make better decisions, from the first foundation pour to the final inspection.